Subscribe to receive tips, project insights, and exclusive resources.
Thank you! Your submission has been received!
Oops! Something went wrong while submitting the form.
We respect your privacy. Unsubscribe at any time.
cost per engineering outcome
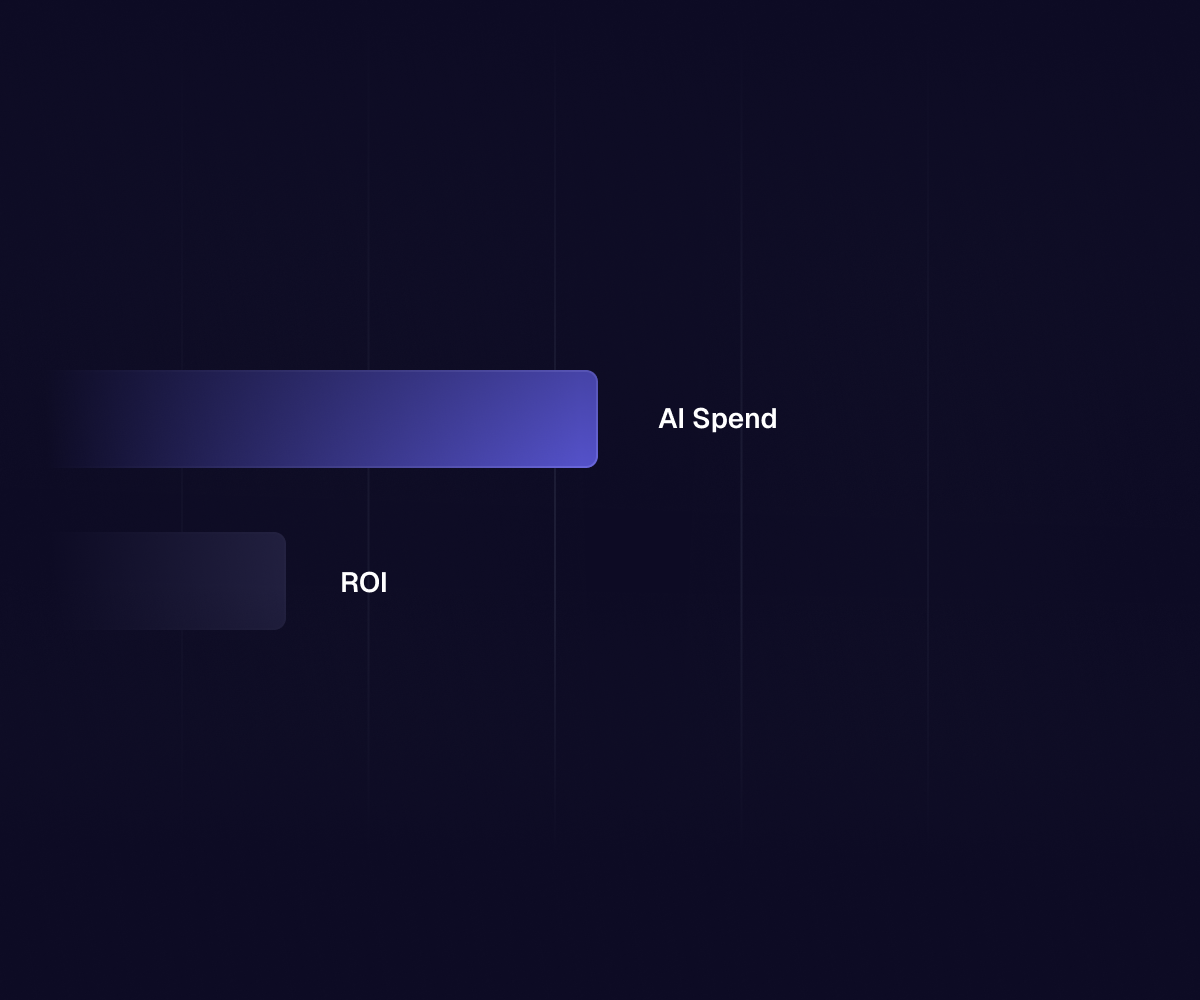
AI spend · adoption · $ per merged PR
Make agentic engineering measurable across your organization.
Measure adoption, cost, and delivery impact across teams and AI tools. For every metric, see exactly which developers, providers, and repositories are covered.
Connect the sources that make up the engineering picture
coming soon
coming soon
Why verdo
See how AI is used across engineering. Connect adoption and spend to outcomes.
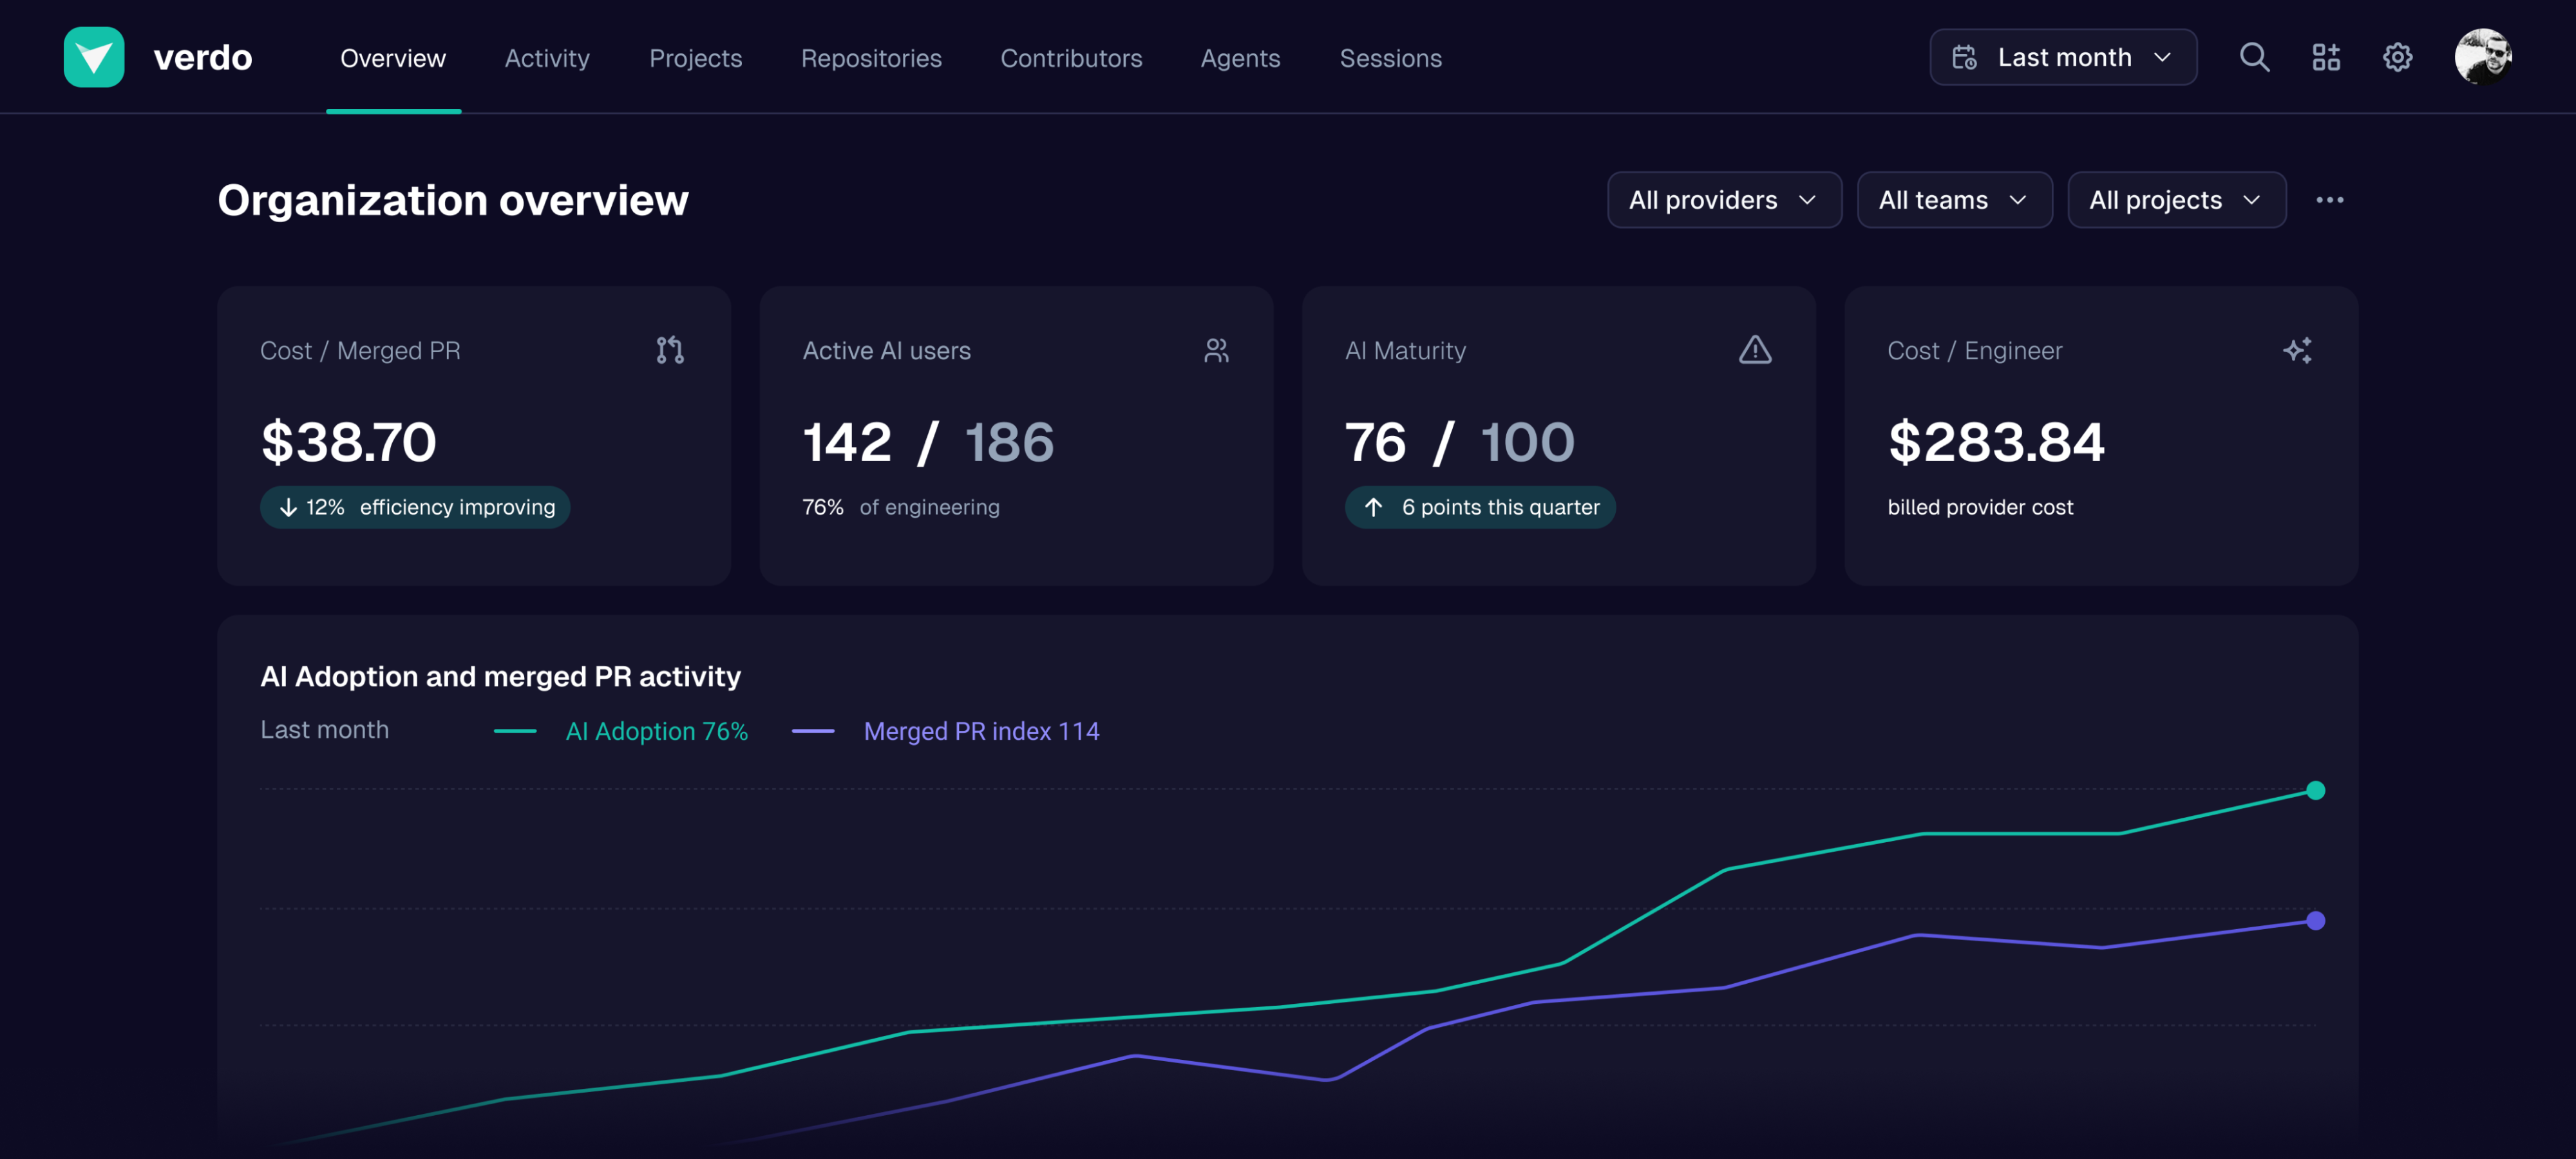
AI is already part of engineering. Verdo shows how adoption is evolving across teams, what AI costs in the context of engineering outcomes, and where there is room to improve.
The VP Eng asks
"Which teams are adopting AI, and where is engineering performance moving with it?"
The buyer needs one cross-tool view of adoption, maturity, cost, and engineering activity.
The CFO asks
“Are we getting the expected return from our AI investment?”
Finance needs to understand how AI investment translates into engineering usage, performance, and outcomes.
The board asks
“How far along is our AI engineering transformation?”
Seat counts do not show whether AI has become part of how the engineering organization works.
Built for engineering leaders. Run with your Developer Experience or Platform Engineering team.
Leadership gets the organizational view; the internal platform team operates the system.
"Which teams are adopting AI, and where is engineering performance moving with it?"
The buyer needs one cross-tool view of adoption, maturity, cost, and engineering activity.
The CFO asks
“Are we getting the expected return from our AI investment?”
Finance needs to understand how AI investment translates into engineering usage, performance, and outcomes.
The board asks
“How far along is our AI engineering transformation?”
Seat counts do not show whether AI has become part of how the engineering organization works.
Built for engineering leaders. Run with your Developer Experience or Platform Engineering team.
Leadership gets the organizational view; the internal platform team operates the system.
Product
The data layer for AI engineering. Adoption, economics, and outcomes in context.
Verdo combines provider usage and cost, developer-side activity, and Git data. Each metric shows its source and coverage, so leaders know how confidently they can act.
Adoption and maturity
See who uses AI, how regularly, and which teams are ahead, behind, or ready for enablement. Maturity scores frequency and breadth of AI use, per team.
Engineering economics
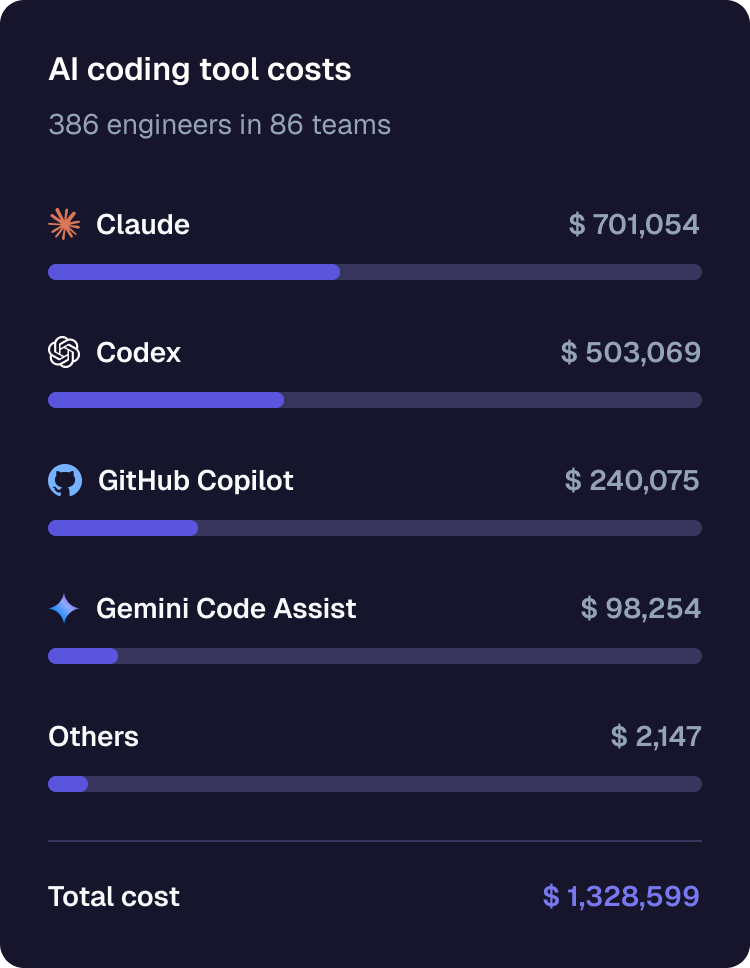
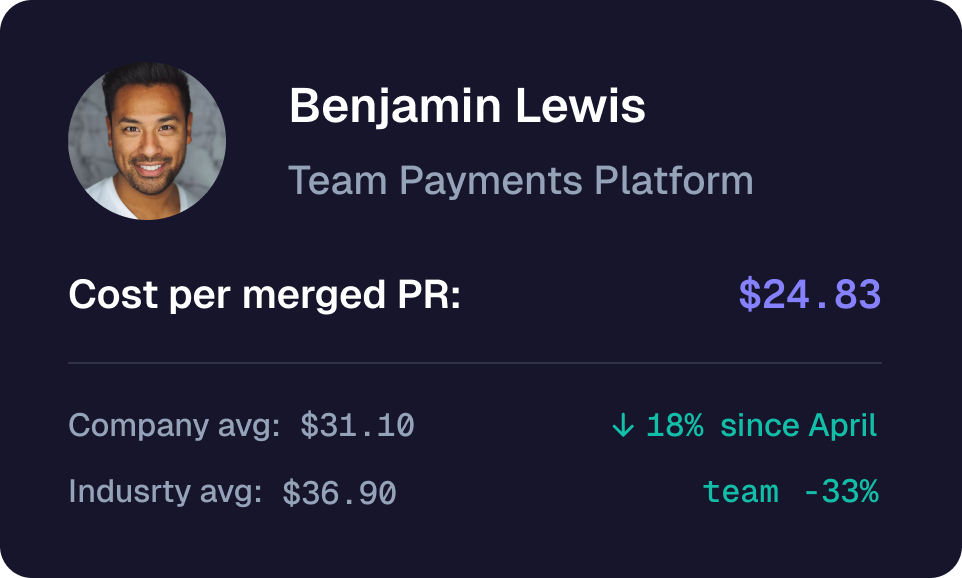
Put AI cost in the units engineering leaders manage, instead of stopping at tokens or invoices.
Engineering outcomes
Place AI activity alongside merged PRs, cycle time, repositories, and team trends without pretending correlation proves causation.
Know what every number represents.
Every metric is labeled as measured, allocated, derived, unavailable, or stale.
The coverage ledger shows what share of the intended organization, sources, and time period each metric represents.Most AI dashboards show whoever happened to install a plugin, and call it the organization.
Ask any tool one question: What share of our AI activity do you actually see?
Coverage ledger
Last month
78%
observed
12% allocated
6% unavailable
4% stale
Provider cost
96%
measured
Developer activity
78%
measured
Cost per merged PR
82%
derived
Unavailable activity
22%
disclosed
How it works
Live in a day.
Deepen the view over time.
Two read-only connections make you live. The third step is optional on day one, and it unlocks the adoption history nothing else can see.
Add read-only Anthropic and OpenAI connections for available usage, models, and billed provider cost.
Step 2
Add Git context
Authorize GitHub or GitLab, read-only. Verdo maps activity to contributors, teams, repositories, and merged PRs.
Step 3 – unlock adoption depth
Add Verdo Capture
When you are ready: one command backfills weeks of the developer activity admin APIs cannot expose. No agent, no daemon, nothing keeps running.
For Engineers
Capture the activity admin APIs cannot see.
Subscription usage often lives in local session logs rather than provider admin APIs. Verdo Capture fills that gap and can establish a historical adoption baseline on day one.
Adoption, spend, cost per engineer, cost per merged PR, Git context, and coverage.
Next
Understand
Task and PR relationships, team maturity, model comparisons, and broader tool coverage.
Later
Improve
Recommendations for enablement, licenses, models, tools, and engineering efficiency.
Future
Govern
Provenance, policy, audit, compliance, and governance on the same measurement foundation.
FAQ
Questions engineering teams should ask.
What can Verdo see from provider admin APIs?
Verdo uses only data made available by the connections a customer enables. Available fields vary by provider and may include usage, model, and billed-cost data. Before connection, Verdo documents the fields in scope and the coverage limits.
Why does Verdo combine more than one source?
Provider APIs, GitHub or GitLab, and optional developer-side data answer different questions. Verdo shows the scope and coverage of each enabled source so teams can interpret the resulting view correctly.
How is Verdo different from a coding-assistant dashboard or an observability plugin?
Single-vendor dashboards and developer-side tools answer different questions. Verdo is designed to bring confirmed data from connected provider and source-control systems into one reviewable view.
How does Verdo handle employee visibility?
Verdo is intended for engineering enablement and organizational decisions, not covert surveillance. The fields, roles, and visibility model are documented before real employee data is connected and can be reviewed with security, privacy, and employee-representation stakeholders.
Can our security and privacy teams review Verdo?
Yes. During technical review, Verdo documents the deployment-specific data scope, hosting, processing locations, subprocessors, access model, and retention approach based on the controls actually implemented.
See where AI is changing your engineering organization.
Cloud spend took a decade to become attributable. AI engineering spend is scaling faster. Design partners start with an honest baseline of adoption, engineering economics, and outcomes.
You bring read-only provider access; Capture extends the picture when you are ready. Within days you have your first organizational view, at early-adopter pricing, with a direct line to the founders and real influence on the roadmap.
See where AI is changing your engineering organization.
Cloud spend took a decade to become attributable. AI engineering spend is scaling faster. Design partners start with an honest baseline of adoption, engineering economics, and outcomes.
You bring read-only provider access; Capture extends the picture when you are ready. Within days you have your first organizational view, at early-adopter pricing, with a direct line to the founders and real influence on the roadmap.